
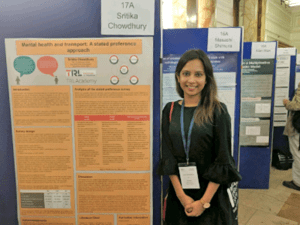
Sritika Chowdhury is a senior statistician at TRL, a global research centre for innovation in transport and mobility. Sritika is heavily involved in statistics, also being a committee member of the Young Statisticians Section (YSS) of the Royal Statistical Society. Her journey in statistics started at university in India, where she studied for her undergraduate degree at St. Xavier’s College in Mumbai, before coming to the UK to study for her MSc in Statistics at the University of Warwick in 2014.

“It’s only when you have representation from different backgrounds, whether it’s ethnicity, gender, age group etc. that you’re able to actually develop a solution that can be applied to the wider community.”
Applying statistics to transport
I did my undergraduate degree in statistics and economics back in India. By the time I graduated, I felt like I had just discovered statistics but I didn’t have a good basis or background in it. Therefore, I decided to pursue a master’s in statistics at the University of Warwick.
After my master’s I didn’t really have a goal or know what I wanted to do next, I was looking at lots of different jobs. The only thing I did know was that I wanted to apply everything I had learned in the last few years.
It was one of my professors at Warwick, Professor Jane Hutton, who had told me about TRL, Transport Research Laboratory. I was fascinated by how they applied statistics to transport in the real world. So, I applied for a job, and here I am. It’s been six years, and now I’ve worked my way up to the role of a senior statistician.
From mental health to active travel, to autonomous vehicles or driver safety
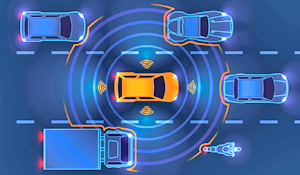
Most of the time, I’m at my desk working away, but my day-to-day job is quite varied because I’m never really working on the same thing. I work on several projects. I might be looking at mental health and transport one day, encouraging active travel in the community on another, looking at the adoption of autonomous vehicles and driverless cars, or young drivers’ safety and the impact of distractions on the roads.
I could be working on a wide variety of topics, using all sorts of data: collision data; vehicle data; survey data, and trying to make sense of all that. Whilst I’m at my desk I also need to summarise all this in a way that can inform policy changes. I’m always excited to see the impact of my projects too.
I am also passionate about encouraging young students, and this is facilitated by MSc projects between TRL and some universities. Students can come and work on a project with us and see how we apply statistics.
Transport is quite a niche. You don’t grow up thinking: “I’m going to work in that field!” So yes, it’s very different. I occasionally travel, which is quite exciting, but I’m mostly at my desk.
Client focus
We work across government and the private sector. We’ve got public sector clients like the Department of Transport, National Highways and Transport for London. We also work with governments and companies from abroad including those from low to middle-income countries, such as Africa and India, for example.
We’ve worked with the private sector as well, especially around autonomous vehicles.
Statistics in the real world
I have worked with Maths4Girls many times, having already spoken at schools events organised by them about how we apply maths and statistics in our day-to-day lives. I have also explained how we use things that we study at school, like the mean, median and mode in statistics. We’re using these all the time.
My passion and purpose: Creating an impact in the community
I believe my main purpose in working is job satisfaction and the impact of what I do in the community means such a lot to me.
Before I joined the TRL, I worked very briefly for three or four months at a bank in India, and whilst that was really exciting and a completely different way of looking at a bank, I didn’t find myself motivated or challenged on a day-to-day basis. I was just moving around numbers but was not really involved in understanding where the outcome went or what it impacted.
However, when I started working at TRL, I was heavily involved in a study that trialled a change to the practical driving test and supported by the results from that study, the Government acted, they changed the driving test. Being involved in making roads a safer place for young drivers to learn is amazing. It’s making such an impact that motivates me.
The difference between maths and statistics
I personally found maths at university to be quite different from what you study at school. It’s all about big concepts, using theorems, and there’s a very well-defined structure. You’ve got a theory, and the follow-up process to prove that. As a result, I thought maths was quite theoretical. In contrast, statistics is applied to the real world. You work with really messy data and try to make sense of it. It is quite an open subject, so you may have to use your own judgment.
Therefore, while maths has a well-defined structure, statistics is all about uncertainty — you can never really predict anything with 1o0% confidence. That’s what statistics is all about. It’s accepting what makes up the data and making sense of it, whilst also acknowledging that there is uncertainty in the world.
My biggest supporters
Different people have motivated me at different points in life. My family played a huge role in my love for maths. Growing up, they really encouraged me to pursue STEM, but when I said, “I’m not really interested in this bit, but maths and stats sound interesting,” they supported me.
Then Professor Jane Hutton was my mentor and played a huge role in my life, motivating and challenging me as well as flagging the TRL job opportunity with me. Thankfully, I’ve been able to continue working with her. We meet up almost every year and I’m able to support the university’s MSc course, which I really enjoy.
Diversity helps develop solutions
I think representation in the field of statistics, and STEM in general, is vitally important. In statistics, we talk quite openly about biases in our data, so whenever we are looking at a data set, we’re considering whether the sample actually represents the population. It’s only when you have representation from different backgrounds, whether it’s ethnicity, gender, age group etc. that you’re able to develop a solution that can be applied to the wider community.
Sadly, this often hasn’t been given sufficient consideration in historical studies, especially in medical statistics. I’ve attended talks where we’ve discussed how some studies from the past have actually been biased, so diversity of thought is really important, especially now to fix some of the errors of the past.
Also, it’s important to make sure that in the field of transport, if you’re trying to make it accessible and sustainable, what you find has to actually apply to the whole community and not just a subsection of communities.
Looking to the future…
In general, the field of transport is changing. We’ve got to look at things like driverless cars and understand how they fit in with society, and whether people will accept them and think they’re safe.
We’re also moving away from traditional methods of collecting data, we’re now using things like satellite images as well as using drones and telematics. Data in transport is changing at a fast rate. It’s really exciting for a transport statistician like me to try and make sense of that data, but still make sure that I am accounting for any biases and considering the whole picture.
I look forward to the next few years when all these things kick off, but I’m going to be on maternity leave in a month so for now, I’m focusing on that!