Roger Smith is ONS Head of Earnings. He heads up earnings statistics at the Office for National Statistics (ONS) and oversees a team that turns data into statistics to inform and monitor public policy.

“…It’s perfectly possible to have a gender pay gap even if men and women doing the same job are paid exactly the same; this is because men and women tend to different types of job, with different pay structures…”
Roger, please can you give us a bit of background about the role of ONS in gathering statistics on the gender pay gap?
We run the Annual Survey of Hours and Earnings, which collects information from employers about roughly 180,000 employee jobs each year. This very big random sample allows us to produce a variety of important statistics about work and pay, including calculating the gender pay gap.
The two main gender pay gap figures that we publish relate to ‘all employees’ (amongst whom the gap is 18.4%) and ‘full time employees’ (9.1%). The 9.1% figure means broadly that – taking into account all full time employee jobs (excluding self-employed) – men earn 9.1% per hour more than women. These are critical numbers, but there’s a lot take into account when interpreting what they – and other gender pay gap numbers – mean, and that’s where we aim to help.
Firstly, it’s important that we make clear what the gender pay gap measure is and what it isn’t. It is a measure of comparative pay across all jobs within a specific area, for example the UK as a whole, or in regions of the UK, or in certain occupations and industries. It isn’t a measure of men’s and women’s pay rates for identical jobs. It’s perfectly possible to have a gender pay gap even if men and women doing the same job are paid exactly the same; this is because men and women tend to different types of job, with different pay structures.
We also need to make sure that additional information is provided to help understand the pay gap. For example, why is the gender pay gap much bigger among all employees than among only full time employees? We show that this is because women are much more likely than men to work part time, and part time jobs have lower hourly rates of pay.
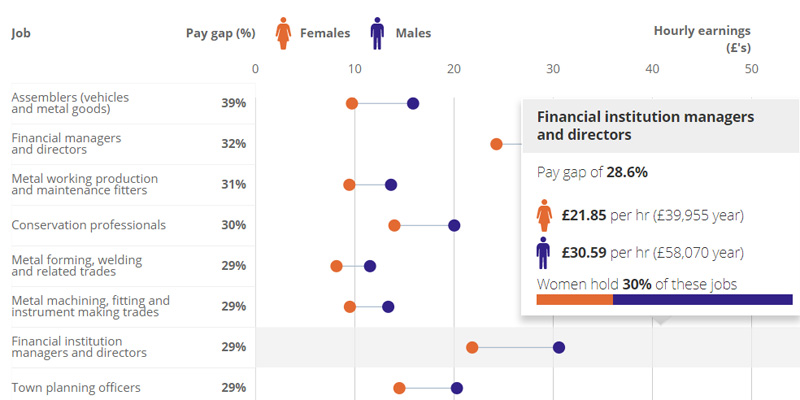
Does the gender pay gap vary by age? Yes, it is much lower until a certain age, at which point it begins to widen. Is the gender pay gap the same in all types of job? No, but the survey gives us extra insights such as women are more likely than men to work in lower-paid occupations such as administration and caring, but are much less likely to be managers, directors and senior officials.
While the gap has narrowed for older women working part-time, there’s still a dramatic difference between men and women between 40 and 49 working full-time https://t.co/tHAR4l7bx2 pic.twitter.com/3xyH0VdWui
— ONS (@ONS) November 27, 2017
How does the information you provide differ from the gender pay gap figures provided by employers under the new reporting regime for organisations employing 250 or more staff?
Our figures are at a relatively broad level. For example, in 2017 some of our main published figures were a 10% gender pay gap for full-time employee jobs in England, and a gap of minus 3.4% in Northern Ireland (that is, women on average earn more per hour than men in Northern Ireland, which we believe is due to a high proportion of women working in the public sector in Northern Ireland).
In Northern Ireland, women working full-time earn 3.4% more per hour, on average, than men – the only region in the UK where this is the case https://t.co/tHAR4l7bx2 pic.twitter.com/ksK2UaRzSM
— ONS (@ONS) November 27, 2017
Although we do publish figures at a more localised level than that, such as by local authority, we don’t set out to report anything for individual employers. The Government requirement for companies with 250 or more employees to report their gender pay gap will complement our figures, allowing people to dig deeper into the extent of, and possible reasons for, gender pay gaps at that more local level.
Why are accurate statistics so essential to help reduce the gender pay gap?
Accurate statistics inform debate, and allow people to look into areas so they might understand the nature, and causes, of disparity. For example, I mentioned that the gender pay begins to widen after a certain age.
We see at that point that the proportion of women working part time increases, presumably driven in large part by women returning to work after having a child. That should then focus attention on the question of ‘why’s that?’. Is it because women want to work that way, or because they don’t feel they are able to work full time, or a combination of both? And the fact that the pay gap widens should make people question why that is – are women left behind in career progression because of the way they return to work after childbirth?
When policies are implemented by Government and other bodies, it’s important to have statistics to help understand their impact. Tracking the gender pay gap over time in the UK, for example, we see that – among full-time employees – it has fallen from 17.4% in 1997 to 9.1% in 2017.
The European statistics agency, Eurostat, publishes comparative statistics across the continent. This shows that the UK gender pay gap is higher than average – in 2015 the UK figure for all employees was over 20%, compared with close to 5% in Italy, for example. That’s a pointer to try and understand what is different in countries like Italy, and what can be learnt from their labour market structure.
Also, as has recently been flagged in the media, how about the percentage of men who take up shared parental leave? I haven’t seen accurate statistics for that, but the suggestion is that the percentage is far lower in the UK than in other countries. If more statistics were available it might help to get a better understanding of why that is, and how it might be impacting on the gender pay gap.
ONS has developed a new type of analysis that breaks down the gender pay gap by the factors that influence men’s and women’s pay. Please could you give us a basic overview of the techniques used and what this tells us?
We presented this new analysis in an article intended to help improve the understanding of the gender pay gap reported by ONS. It analysed the gender pay gap using our usual methodology (comparing the median hourly pay of full time workers) for various characteristics such as age, working pattern, the length of time people have been in their current job, and occupation. It then modelled men’s and women’s pay structures using a statistical technique called ‘linear regression’ to observe the effect of each of these on its own.
We found that as age, length in the job and skill increase, hourly pay rises but the effect of each differs for men and women. The regressions were then compared to examine how much of the gender pay gap can be explained by the characteristics included.
We found that across occupation groups, male full-time workers are paid more than their female counterparts. However, the gender pay gap is low for full time workers younger than 40 and it is widest for those aged 50-59 – at 16.2%. Pay growth is positive for both men and women for most of their working lives, but women’s pay grows less, and stops growing at a younger age, than does men’s pay. The analysis shows that 36% of the difference in earnings can be attributed to the characteristics that we examined. Occupation accounts for 23% of this, and working pattern for 9%.
Where can our readers find out more about your work?
A good starting point for the gender pay gap is the Annual Survey of Hours and Earnings 2017 publication. As well as giving some key figures about the gender pay gap and other aspects of pay, it includes a huge number of related statistics in data tables. We also publish lots of other articles about gender pay, such as the analysis you mentioned in the last question, for example
We like to try to make statistics as relevant to individuals as possible, so everyone can explore the gender pay gap in your own occupation, or check how your perceptions compare to reality in our gender pay gap quiz.
I’m really pleased to have been able to talk about the gender pay gap; it’s an extremely important topic. The ONS publishes a huge number of critical statistics – I’m sure your readers will find some fascinating information on our website. The other things we measure are also really important for people’s lives, including things such as inflation and crime. And, as the UK’s largest producer of official statistics, we proactively support the open data too. We are committed to releasing data in a way which will allow maximum re-use of information.
Do follow us on social media to stay informed about our work. You can now send us your questions about ONS or ONS statistics via Facebook messages and Twitter direct messages too.
Do you have a question about us or our statistics? Our Twitter channel now provides support 9am-4pm Mon-Fri. We look forward to helping you pic.twitter.com/uCfEpQdq8O
— ONS (@ONS) November 13, 2017
http://www.ons.gov.uk/ons/index.html
https://www.linkedin.com/company/office-for-national-statistics